
Priced in Gold, the New U.S. Home Is Near Its Cheapest Since 1963
By First National Bullion
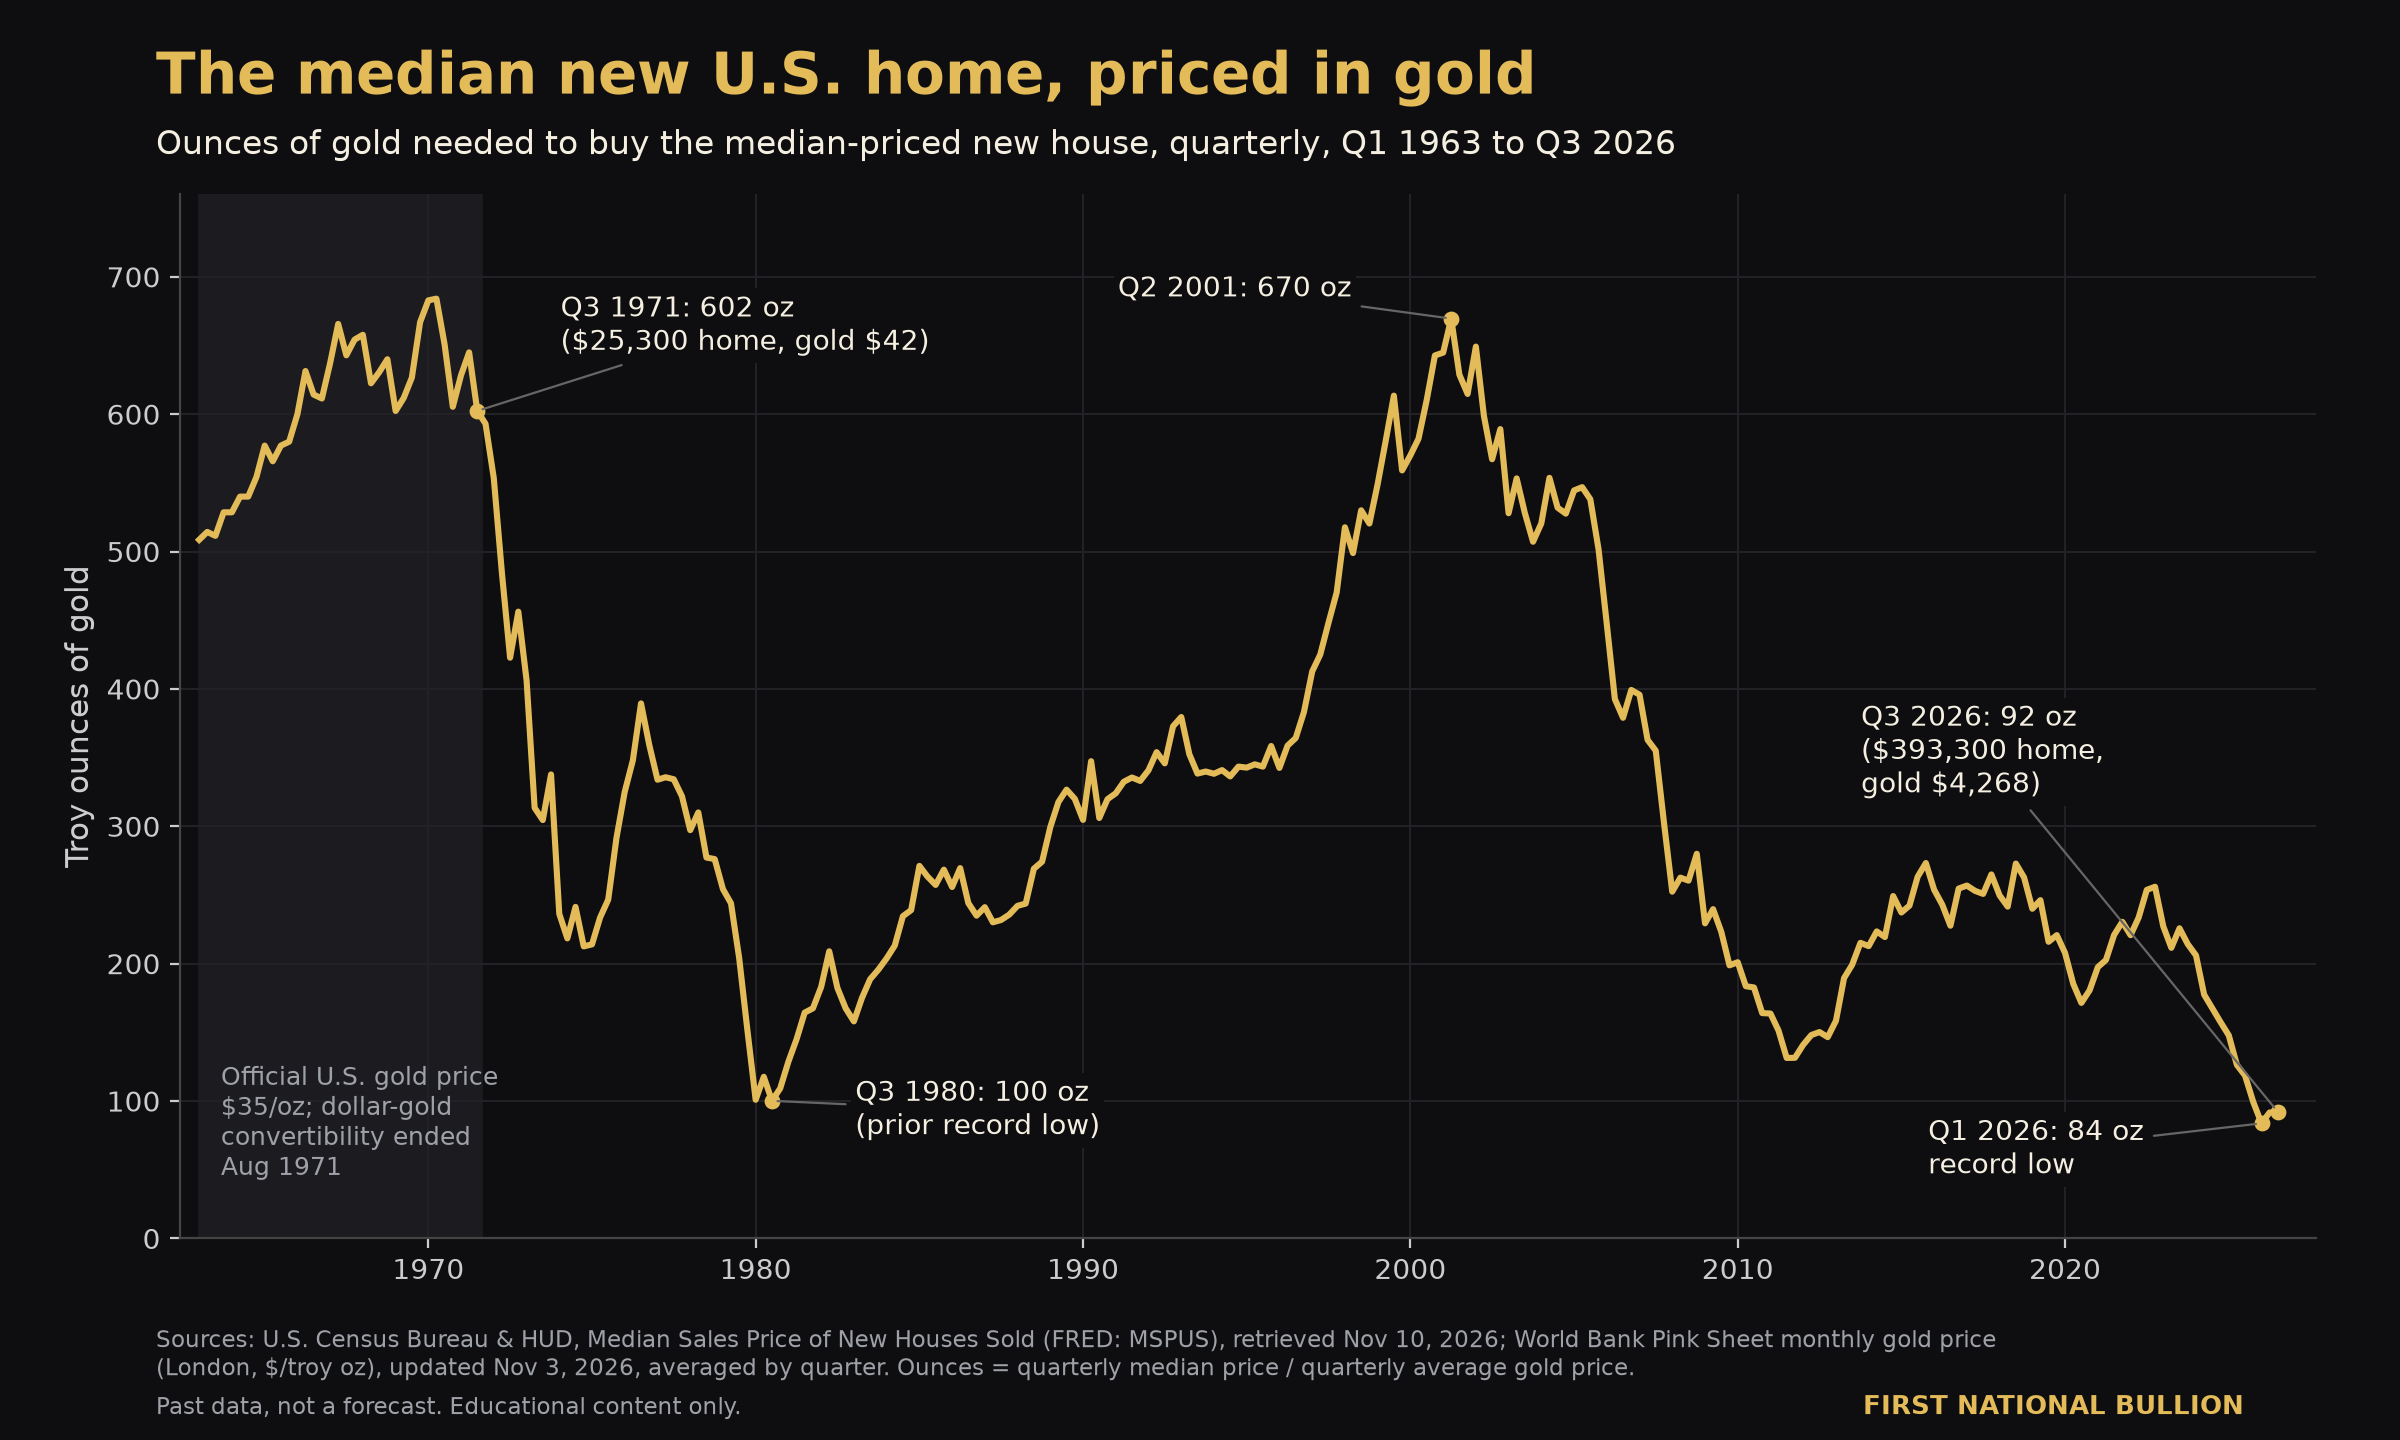
Gold isn’t a perfect price anchor. But over long periods it has kept far more purchasing power than the dollar, which is why many hold it as a modest slice of savings.
The honest case for gold is not that it is a perfect price anchor. It is that, over long periods, it has kept far more purchasing power than paper currency. It also swings hard, pays no income and has to be stored. That is why many people who own it hold it as a modest slice of their savings, not the whole thing. One of the clearest ways to see both sides is to price an American house in gold.
The same house, two yardsticks
The U.S. Census Bureau has published the median sales price of new houses sold every quarter since 1963. Divide that price by the average gold price in the same quarter and you get the house’s price in ounces of gold.
- Q3 1971, the quarter the U.S. stopped converting dollars into gold: the median new house sold for $25,300. Gold averaged about $42 an ounce on the London market. The house cost about 602 ounces.
- Q3 2026: the median new house sold for $393,300, about 15.5 times as many dollars. Gold averaged about $4,268, about 102 times as much. The same house cost about 92 ounces.
In dollars, the median new house sits about 11% below its record of $442,600 (Q4 2022). In gold, it is near the cheapest it has been in 63 years of Census data. The three lowest readings on record are the last three quarters, led by about 84 ounces in Q1 2026. The previous low, about 100 ounces, came in 1980.
What the chart does and doesn’t say
It does not mean houses are cheap, or that gold will keep rising. The ratio has swung from about 684 ounces (1970) to about 100 (1980), back up to about 670 (2001), and down to about 84 (2026). It can swing back. The move from 84 to 92 ounces this year came mostly from gold: its quarterly average fell about 12% from Q1 to Q3 2026, while the median house price fell about 4%.
What the long view does show is that gold, unlike cash, has broadly kept up with one of the biggest purchases most households ever make. An ounce of gold averaged about $43 in August 1971 and $4,105 in October 2026. A dollar today buys about 1% of the gold it bought then.
Testing the folklore
You will often hear that an ounce of gold buys the same goods in any century: a good suit, a head of cattle. The data doesn’t support that. On World Bank benchmark prices, 100 kg of beef cost about 3.1 ounces of gold in August 1971 and about 0.17 ounces in October 2026, a drop of about 95%. Gold’s relationship to any single good drifts a great deal. Its case rests on the long run against paper money, not on a fixed exchange rate with steaks or houses.
The trade-offs
Gold pays no interest or dividends. Its price is volatile: its annual average fell from $608 in 1980 to $271 in 2001, a drop of about 55%, and its annual average did not top the 1980 level again until 2007. Physical gold also has to be stored and insured, and buying and selling it has costs. Those are the reasons it is usually held as a modest slice of savings, not the whole thing.
Past data, not a forecast. Educational content only, not investment, tax or legal advice. First National Bullion sells precious metals and is a sponsor of WOLF STREET.
Sources: U.S. Census Bureau and U.S. Department of Housing and Urban Development, Median Sales Price of New Houses Sold for the United States [MSPUS], quarterly, not seasonally adjusted, retrieved from FRED, Federal Reserve Bank of St. Louis, Nov 10, 2026 (latest observation Q3 2026, updated Oct 27, 2026). World Bank Commodity Price Data (The Pink Sheet), monthly gold (/troyoz, London)andbeef(/kg), updated Nov 3, 2026. Ounces = quarterly median price ÷ average of the quarter’s three monthly gold prices.